For traders who want to increase the accuracy of their market analysis. RSI (Relative Strength Index) It's one of the indicators you should always have for use when trading! The RSI (Residual Current Index) measures price momentum by observing price changes over a specified period, helping traders see the current situation. Overbought (Bought too much) or Oversold (Overselling) which effectively indicates a potential price reversal in the future.
How to enable RSI
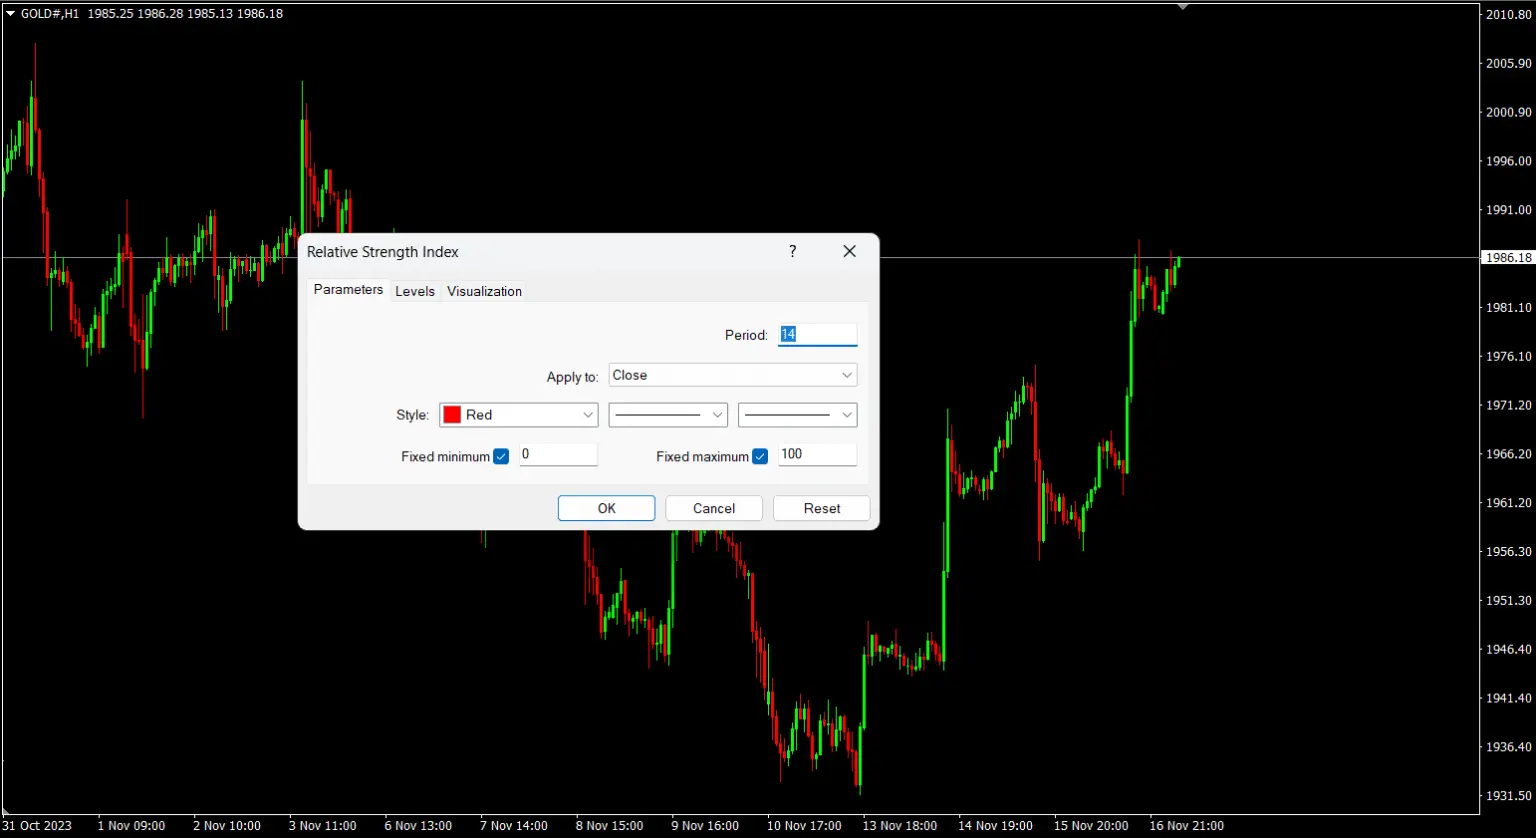
How to use: To activate it in MT4, go to Insert > Oscillators > Relative Strength Index.
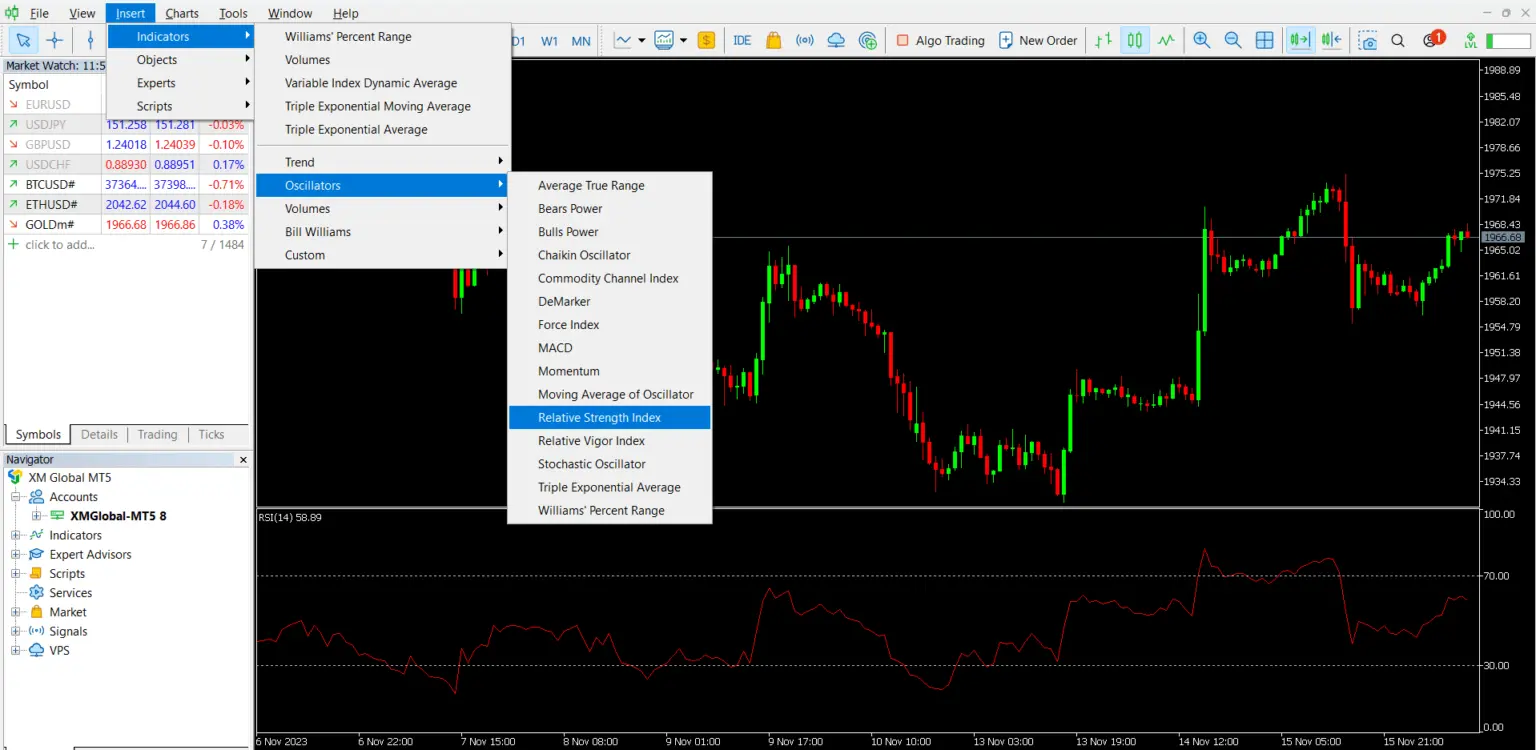
By setting it up, we can use the default period of 14 that the system has configured.
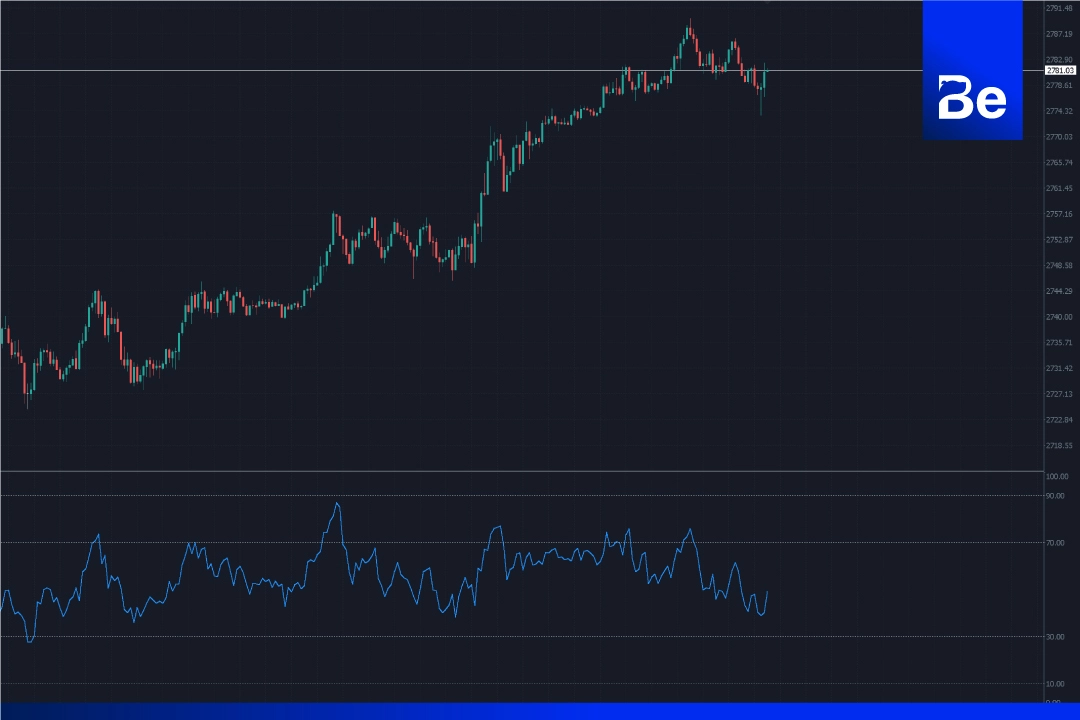
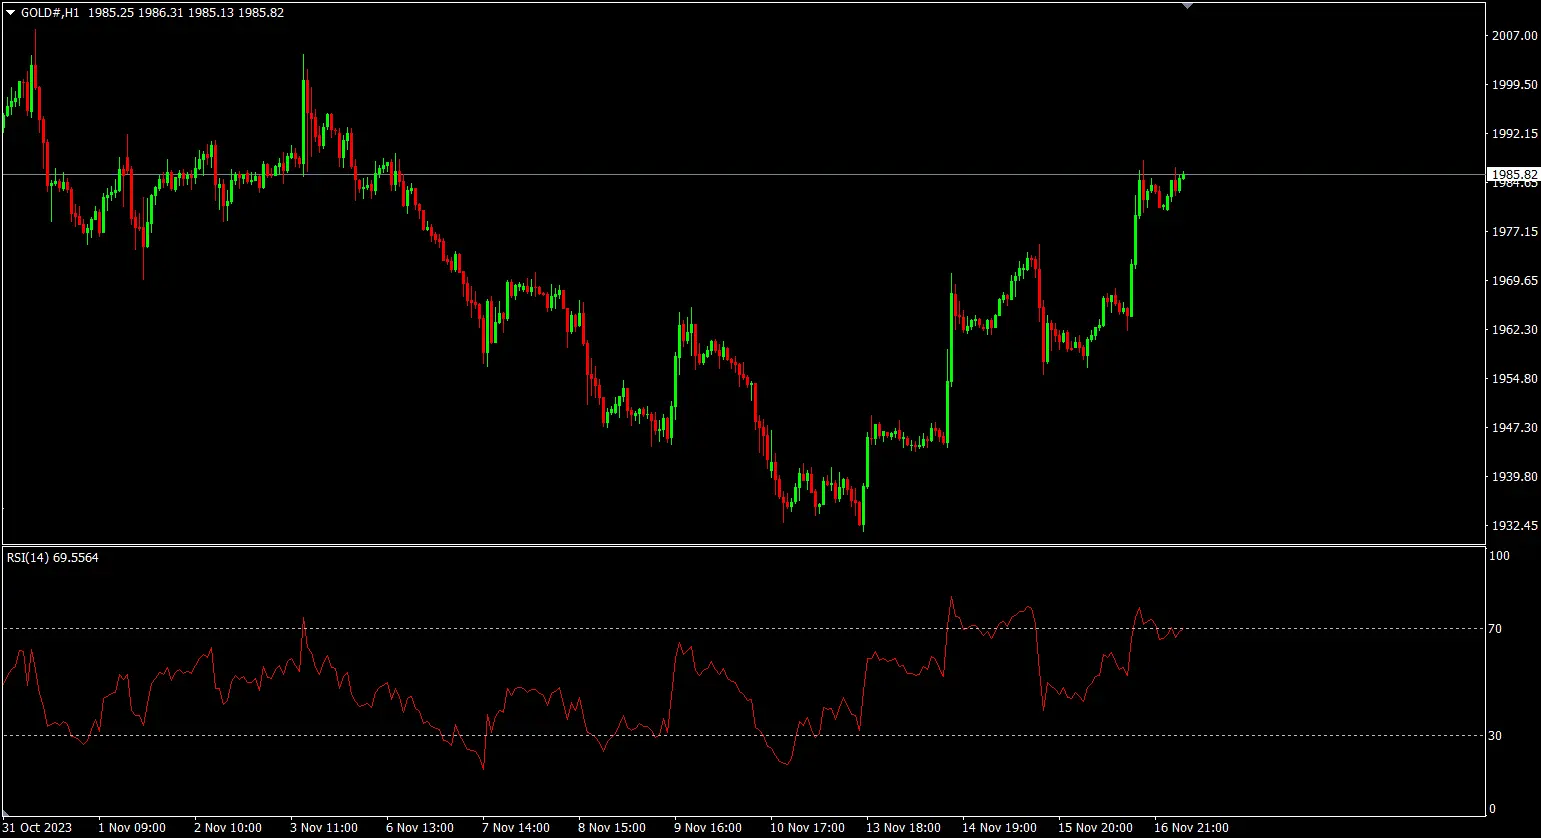
Next, an RSI indicator window will appear below the price chart. We will use the RSI to observe the trading volume of the market during that period.
How to trade using RSI.
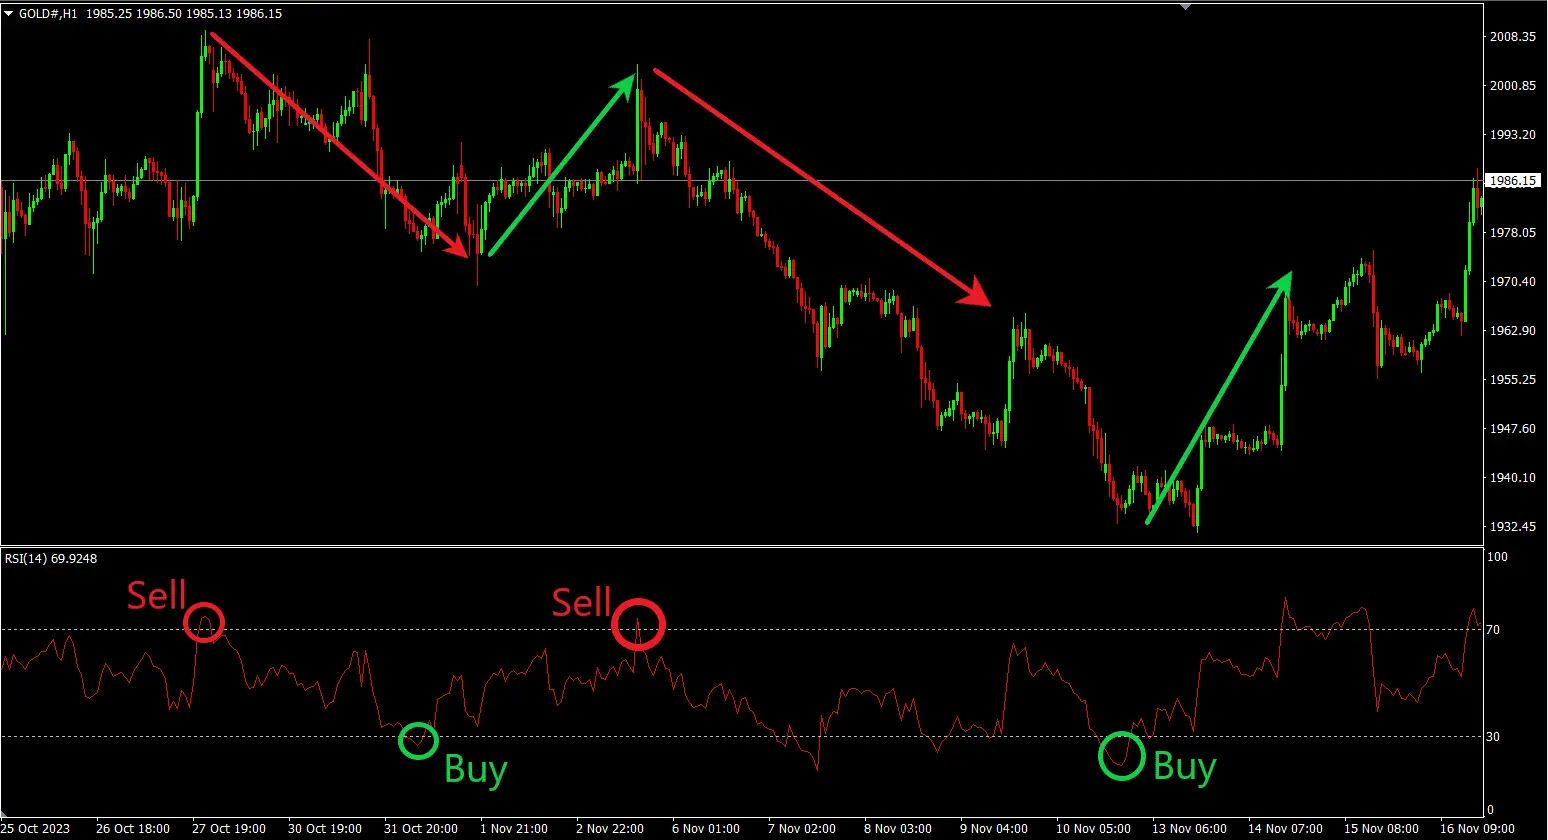
1. Used as a signal to open and close orders.
2. Used to identify price reversal signals.
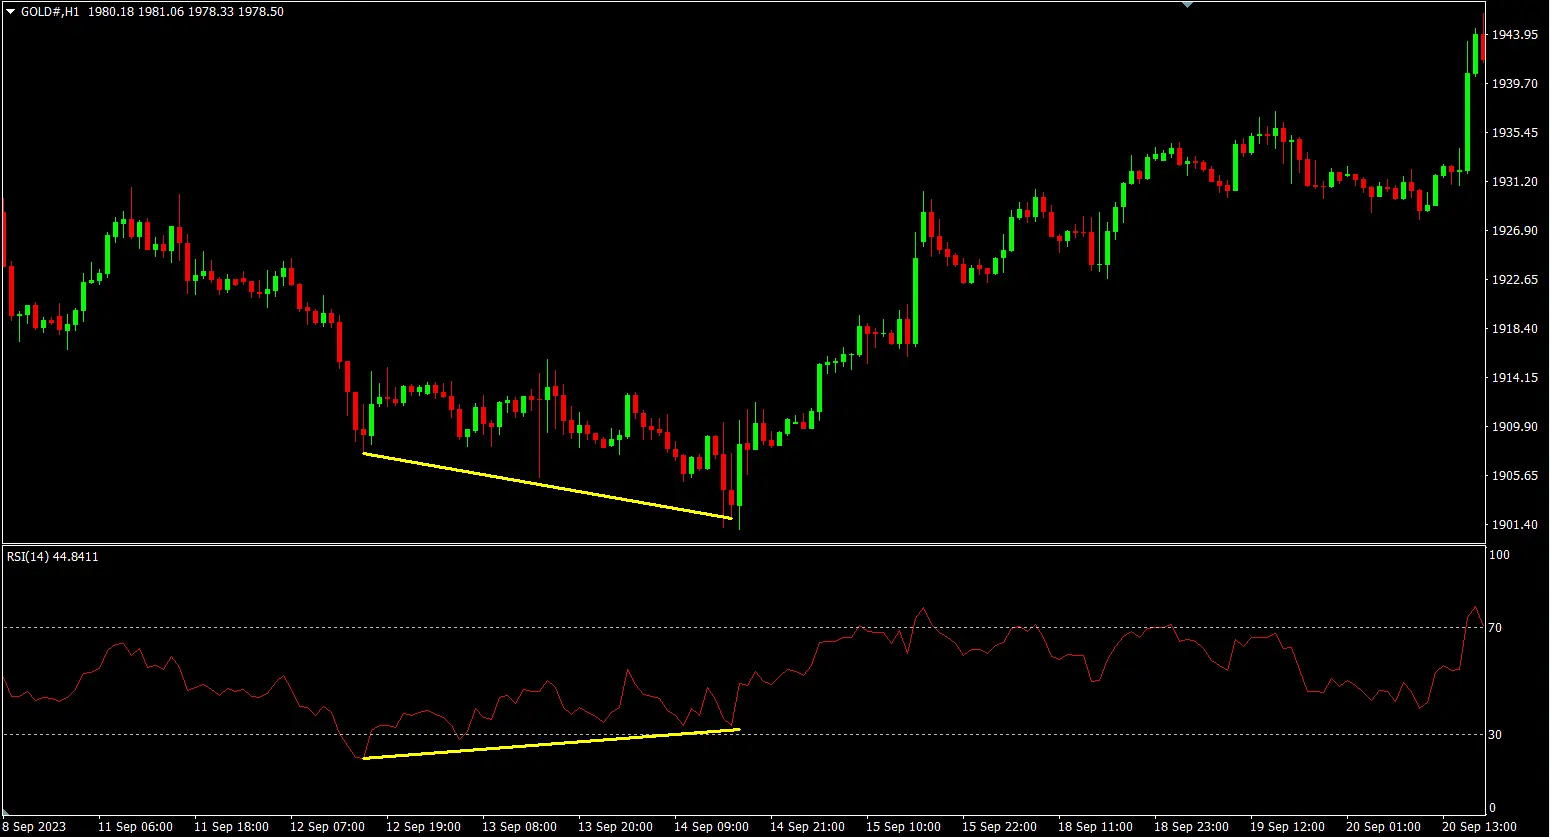
As mentioned earlier, the RSI is a tool used to observe the trading volume of the market during a given period. We can also apply it to identify potential price reversals, which is done by looking for divergence. Divergence is when the price chart's movement doesn't align with the indicator.
Bullish Divergence
This occurs when the trend is downward and the price chart is adjusting downwards, creating new lower lows, while the indicator is showing lower highs. This indicates that while the price continues to fall, the buying volume in the market is increasing, increasing the potential for a price reversal into an uptrend. Traders often use this point as a signal to find a reversal point and open a "Buy" order.“
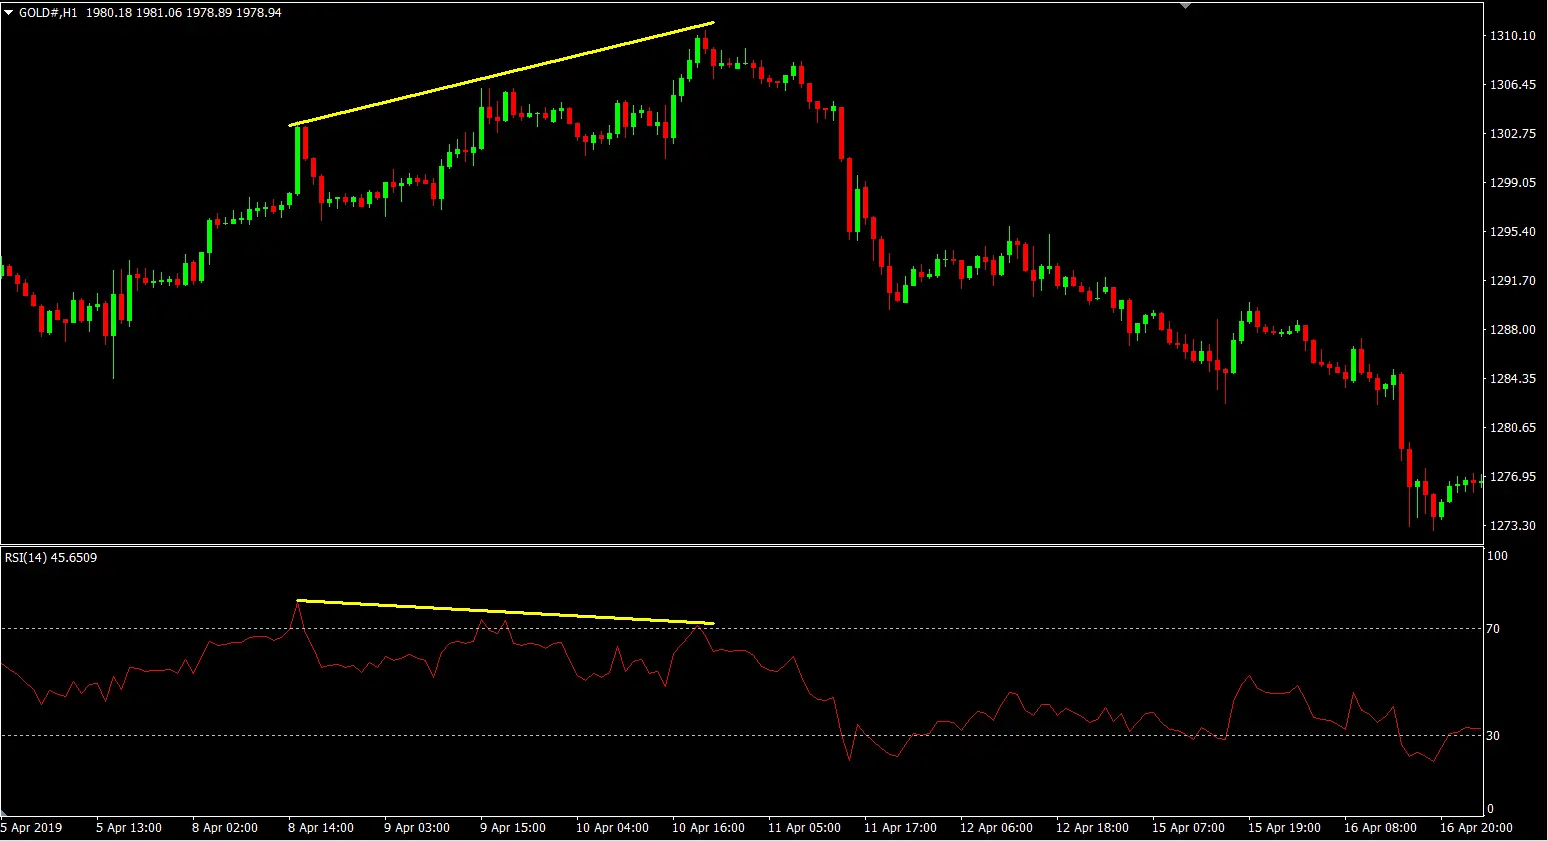
Bearish Divergence
This occurs when the trend is upward and the price chart is making new higher highs, but the indicator is making higher lows. This shows that while the price continues to rise, the trading volume in the market decreases, increasing the likelihood of a price reversal into a downtrend. Traders often use this point as a signal to find a reversal point and open a "Sell" order.“
![Picture of [ADMIN] `SENSEI~](https://besight.net/wp-content/uploads/nsl_avatars/5207db5a26b7923a9ca36d3712820771-150x150.jpg)