Gold Analysis
SPDR Gold Shares Analysis
Track the SPDR fund’s gold holdings with in-depth analysis tools to support your gold trading decisions.
As of October 30, 2026, the SPDR Gold Trust (GLD) holds 1,041.65 tonnes of gold — +0.57 tonnes since the previous trading day and −15.97 tonnes over 7 trading days. Gold (XAUUSD) is at $3,913.25 per ounce.
SPDR Holdings vs Gold Price
The gold price in the chart is the LBMA Gold Price PM that SPDR uses to calculate NAV · green/red bars show changes in holdings

Gold fund holdings
SPDR Gold Shares
Latest holdings
33.49M oz | Value ~ 131.0bn USD
1,041.65
unit = tonnes
Change today
+0.57
unit = tonnes+0.05%
7 trading days
−15.97
unit = tonnes−1.51%
Data from SPDR Gold Trust (spdrgoldshares.com)




SPDR Flow Momentum
Outflow
SPDR outflows are slightly above normal compared with history.
Each score is a percentile against historical data (50 = normal).
SPDR Flow Heatmap
MonthlyOctober 2026
Change today
+0.57 t
7 trading days
−15.97 t
30 trading days
−15.47 t
YTD
−28.91 t
SPDR Flow Streak
1 DAYS INFLOW
Holdings up for 1 trading days in a row
Accumulated Flow
+0.57 t
Gold Performance
−2.81%
Historical records (since 2004)
SPDR Divergence Alert
Confirming DownGold −6.2% over 14 trading days, while SPDR holdings moved −1.3%
Rule: gold moves ≥ 1% and holdings move ≥ 0.5% in opposite directions = divergence
SPDR Flow vs Gold Return
● Latest (Oct 30): +0.57 t · gold −2.81%
SPDR Historical Extreme
Today: +0.57 t
The +0.57 t change today ranks in the top 25% of the largest inflows compared with 10 years of history (2,520 trading days).
SPDR Activity (latest)
Last 60 trading days| Date | Change | Holdings (t) | Size |
|---|---|---|---|
| Oct 30 | +0.57 | 1041.65 | |
| Oct 29 | −2.28 | 1041.08 | |
| Oct 28 | +1.71 | 1043.36 | |
| Oct 27 | +0.85 | 1041.65 | |
| Oct 26 | −0.85 | 1040.80 | |
| Oct 23 | −3.99 | 1041.65 | |
| Oct 22 | −11.98 | 1045.64 | |
| Oct 21 | −2.56 | 1057.62 | |
| Oct 20 | +1.71 | 1060.18 | |
| Oct 19 | −0.57 | 1058.47 | |
| Oct 16 | +5.13 | 1059.04 | |
| Oct 15 | −0.29 | 1053.91 | |
| Oct 14 | 0.00 | 1054.20 | |
| Oct 13 | −1.21 | 1054.20 | |
| Oct 12 | +2.28 | 1055.41 | |
| Oct 9 | −2.28 | 1053.13 | |
| Oct 8 | −5.70 | 1055.41 | |
| Oct 7 | +1.14 | 1061.11 | |
| Oct 6 | +3.70 | 1059.97 | |
| Oct 5 | +0.57 | 1056.27 | |
| Oct 2 | −0.85 | 1055.70 | |
| Oct 1 | +0.85 | 1056.55 | |
| Sep 30 | −1.71 | 1055.70 | |
| Sep 29 | −1.42 | 1057.41 | |
| Sep 28 | +4.28 | 1058.83 | |
| Sep 25 | 0.00 | 1054.55 | |
| Sep 24 | −2.29 | 1054.55 | |
| Sep 23 | +0.86 | 1056.84 | |
| Sep 22 | +0.57 | 1055.98 | |
| Sep 21 | −1.71 | 1055.41 | |
| Sep 18 | +4.28 | 1057.12 | |
| Sep 17 | +0.85 | 1052.84 | |
| Sep 16 | +1.71 | 1051.99 | |
| Sep 15 | +2.86 | 1050.28 | |
| Sep 14 | 0.00 | 1047.42 | |
| Sep 11 | −2.86 | 1047.42 | |
| Sep 10 | −0.35 | 1050.28 | |
| Sep 9 | 0.00 | 1050.63 | |
| Sep 8 | −1.43 | 1050.63 | |
| Sep 4 | −1.42 | 1052.06 | |
| Sep 3 | −3.14 | 1053.48 | |
| Sep 2 | +9.98 | 1056.62 | |
| Sep 1 | +4.28 | 1046.64 | |
| Aug 31 | 0.00 | 1042.36 | |
| Aug 28 | −4.28 | 1042.36 | |
| Aug 27 | +1.14 | 1046.64 | |
| Aug 26 | −2.85 | 1045.50 | |
| Aug 25 | −1.14 | 1048.35 | |
| Aug 24 | +2.28 | 1049.49 | |
| Aug 21 | +8.28 | 1047.21 | |
| Aug 20 | +4.28 | 1038.93 | |
| Aug 19 | +9.41 | 1034.65 | |
| Aug 18 | −5.42 | 1025.24 | |
| Aug 17 | +7.13 | 1030.66 | |
| Aug 14 | +0.29 | 1023.53 | |
| Aug 13 | −2.57 | 1023.24 | |
| Aug 12 | +3.14 | 1025.81 | |
| Aug 11 | +1.71 | 1022.67 | |
| Aug 10 | +3.42 | 1020.96 | |
| Aug 7 | +2.82 | 1017.54 |
ราคาทองคำแท่งขายออกย้อนหลัง
ราคาปิดรายวันของสมาคมค้าทองคำ ตั้งแต่ 16 ต.ค. 2569
62,200
−3800 บาท (−5.76%)
บาท / บาททองคำ 96.5%
Sources: SPDR Gold Trust historical archive (spdrgoldshares.com), updated automatically every day · real-time gold and Thai gold prices · Momentum / Regime indicators are BeSight’s analysis, not SPDR data · Not investment advice
News & Insights
News and market views
Follow economic news, market analysis and key updates from BeSight.
BeSight Update
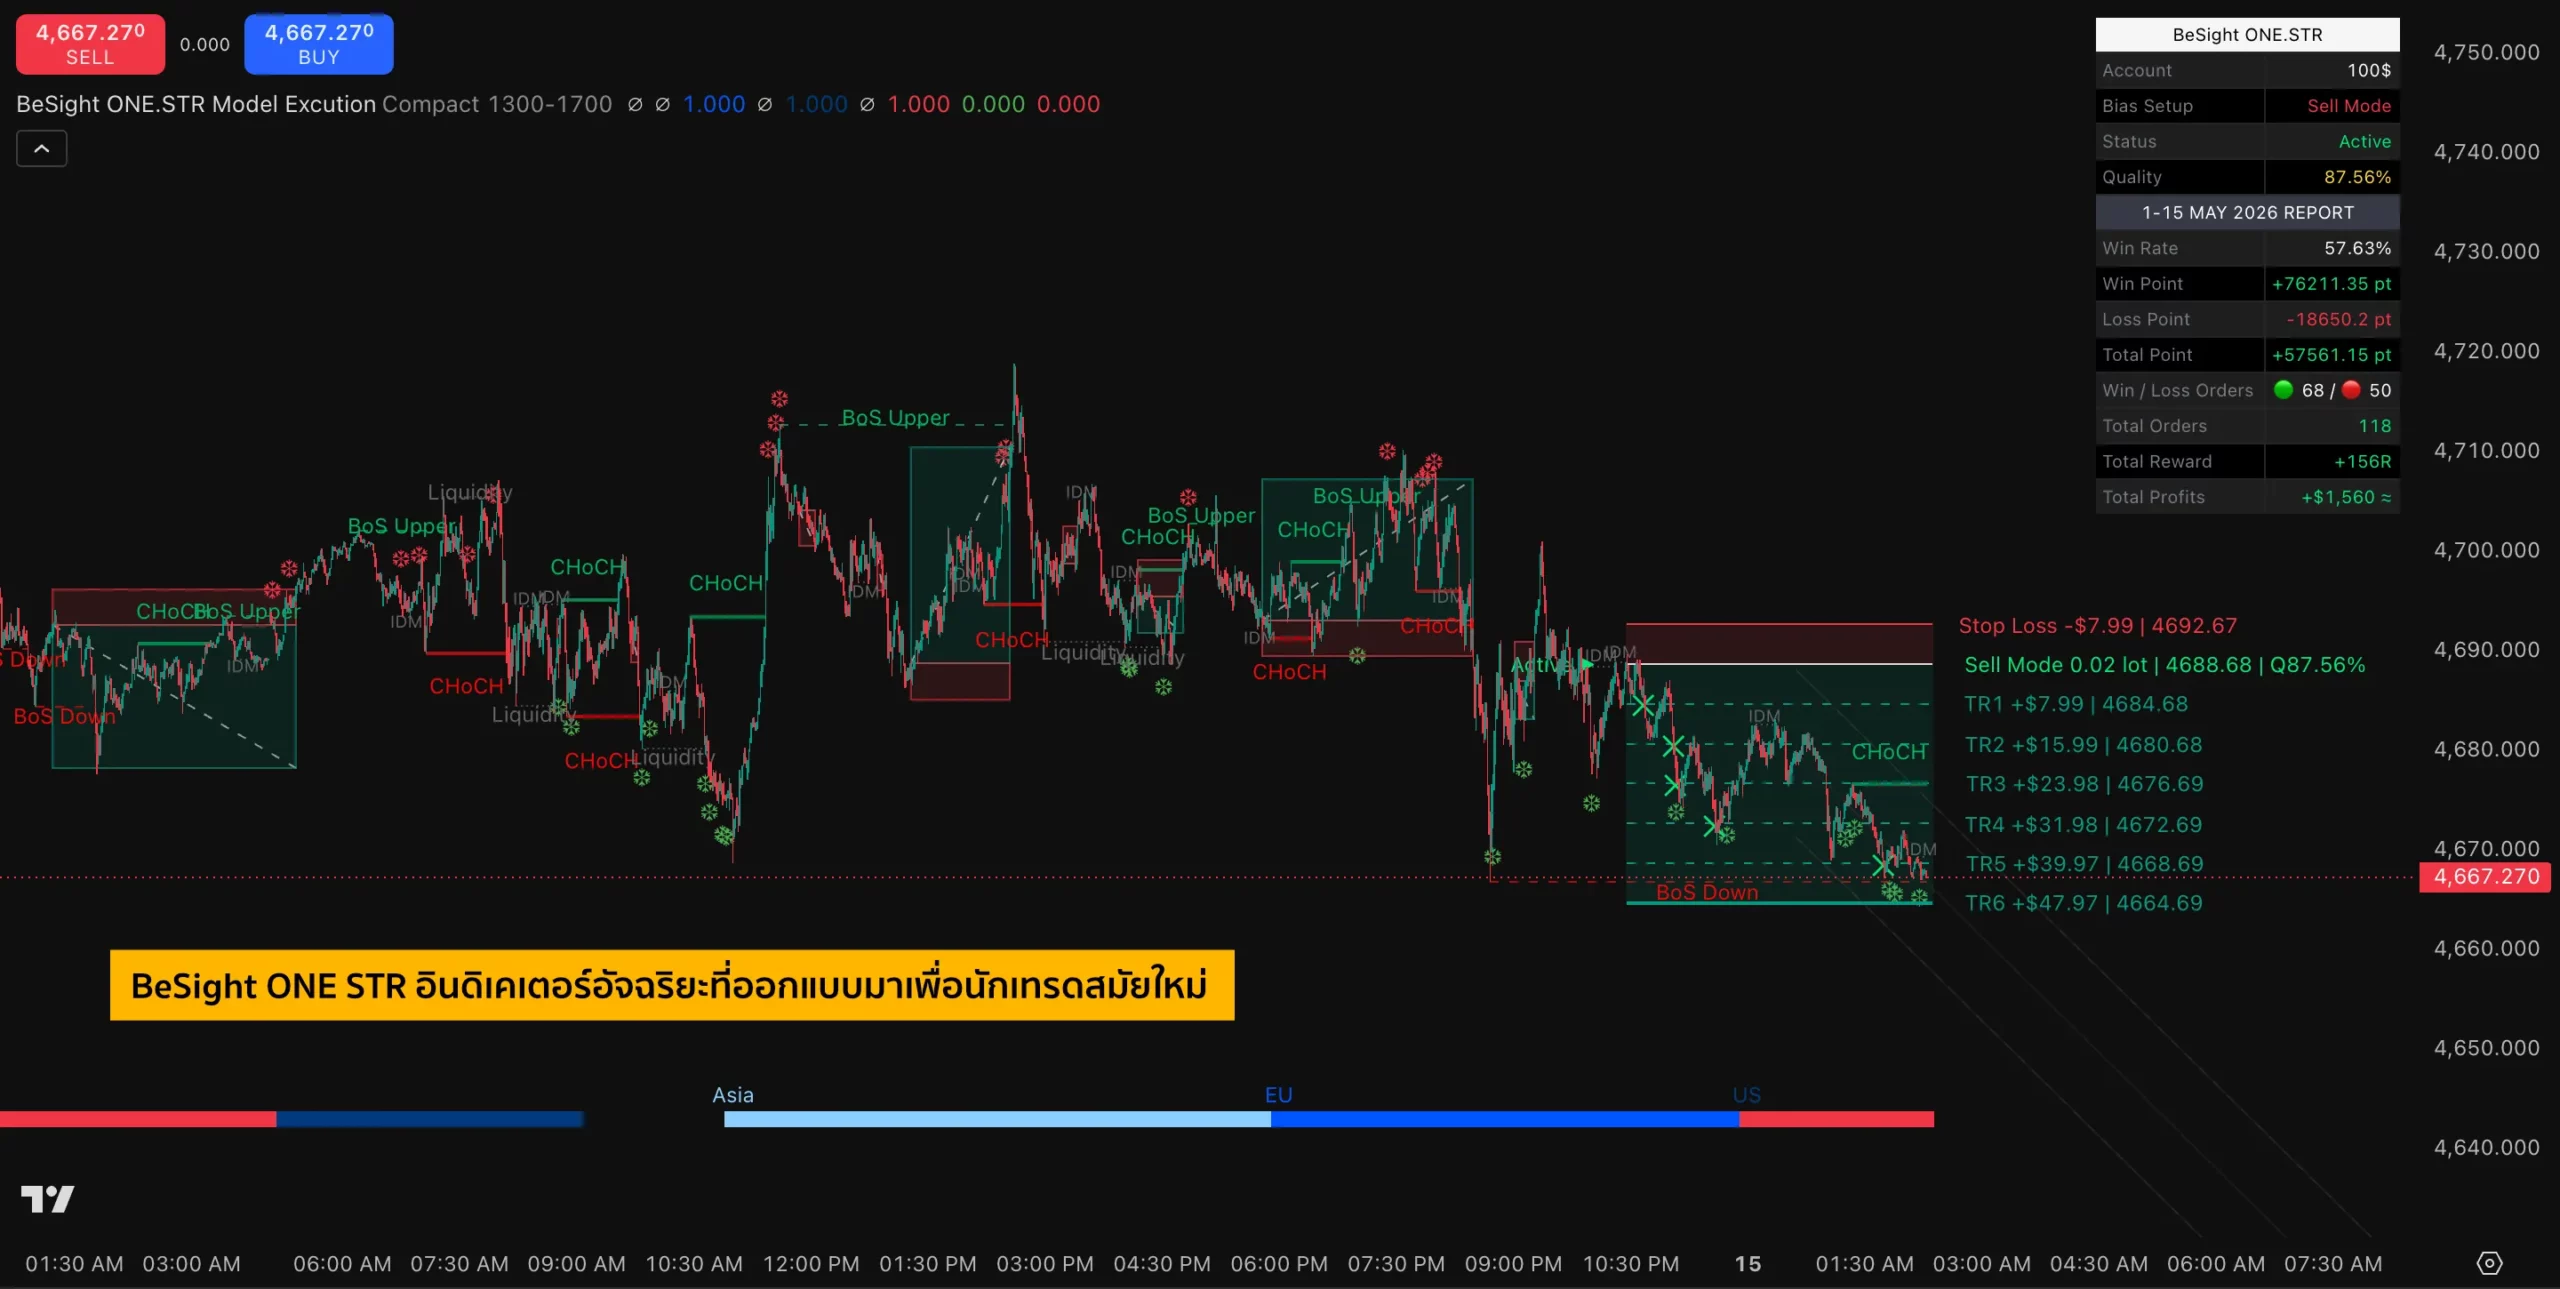
เปิดตัว BeSight ONE STR อินดี้เทรดทองขั้นเทพ บน TradingView
เครื่องมือ Execution Model รุ่นใหม่บน TradingView ที่รวม Market Analysis, Risk Management และ Data Tracking ไว้ในตัวเดียว ช่วยระบุ BoS/CHoCH, คำนวณ Lot Size และแจ้งเตือนสัญญาณแบบเรียลไทม์
BeSight Update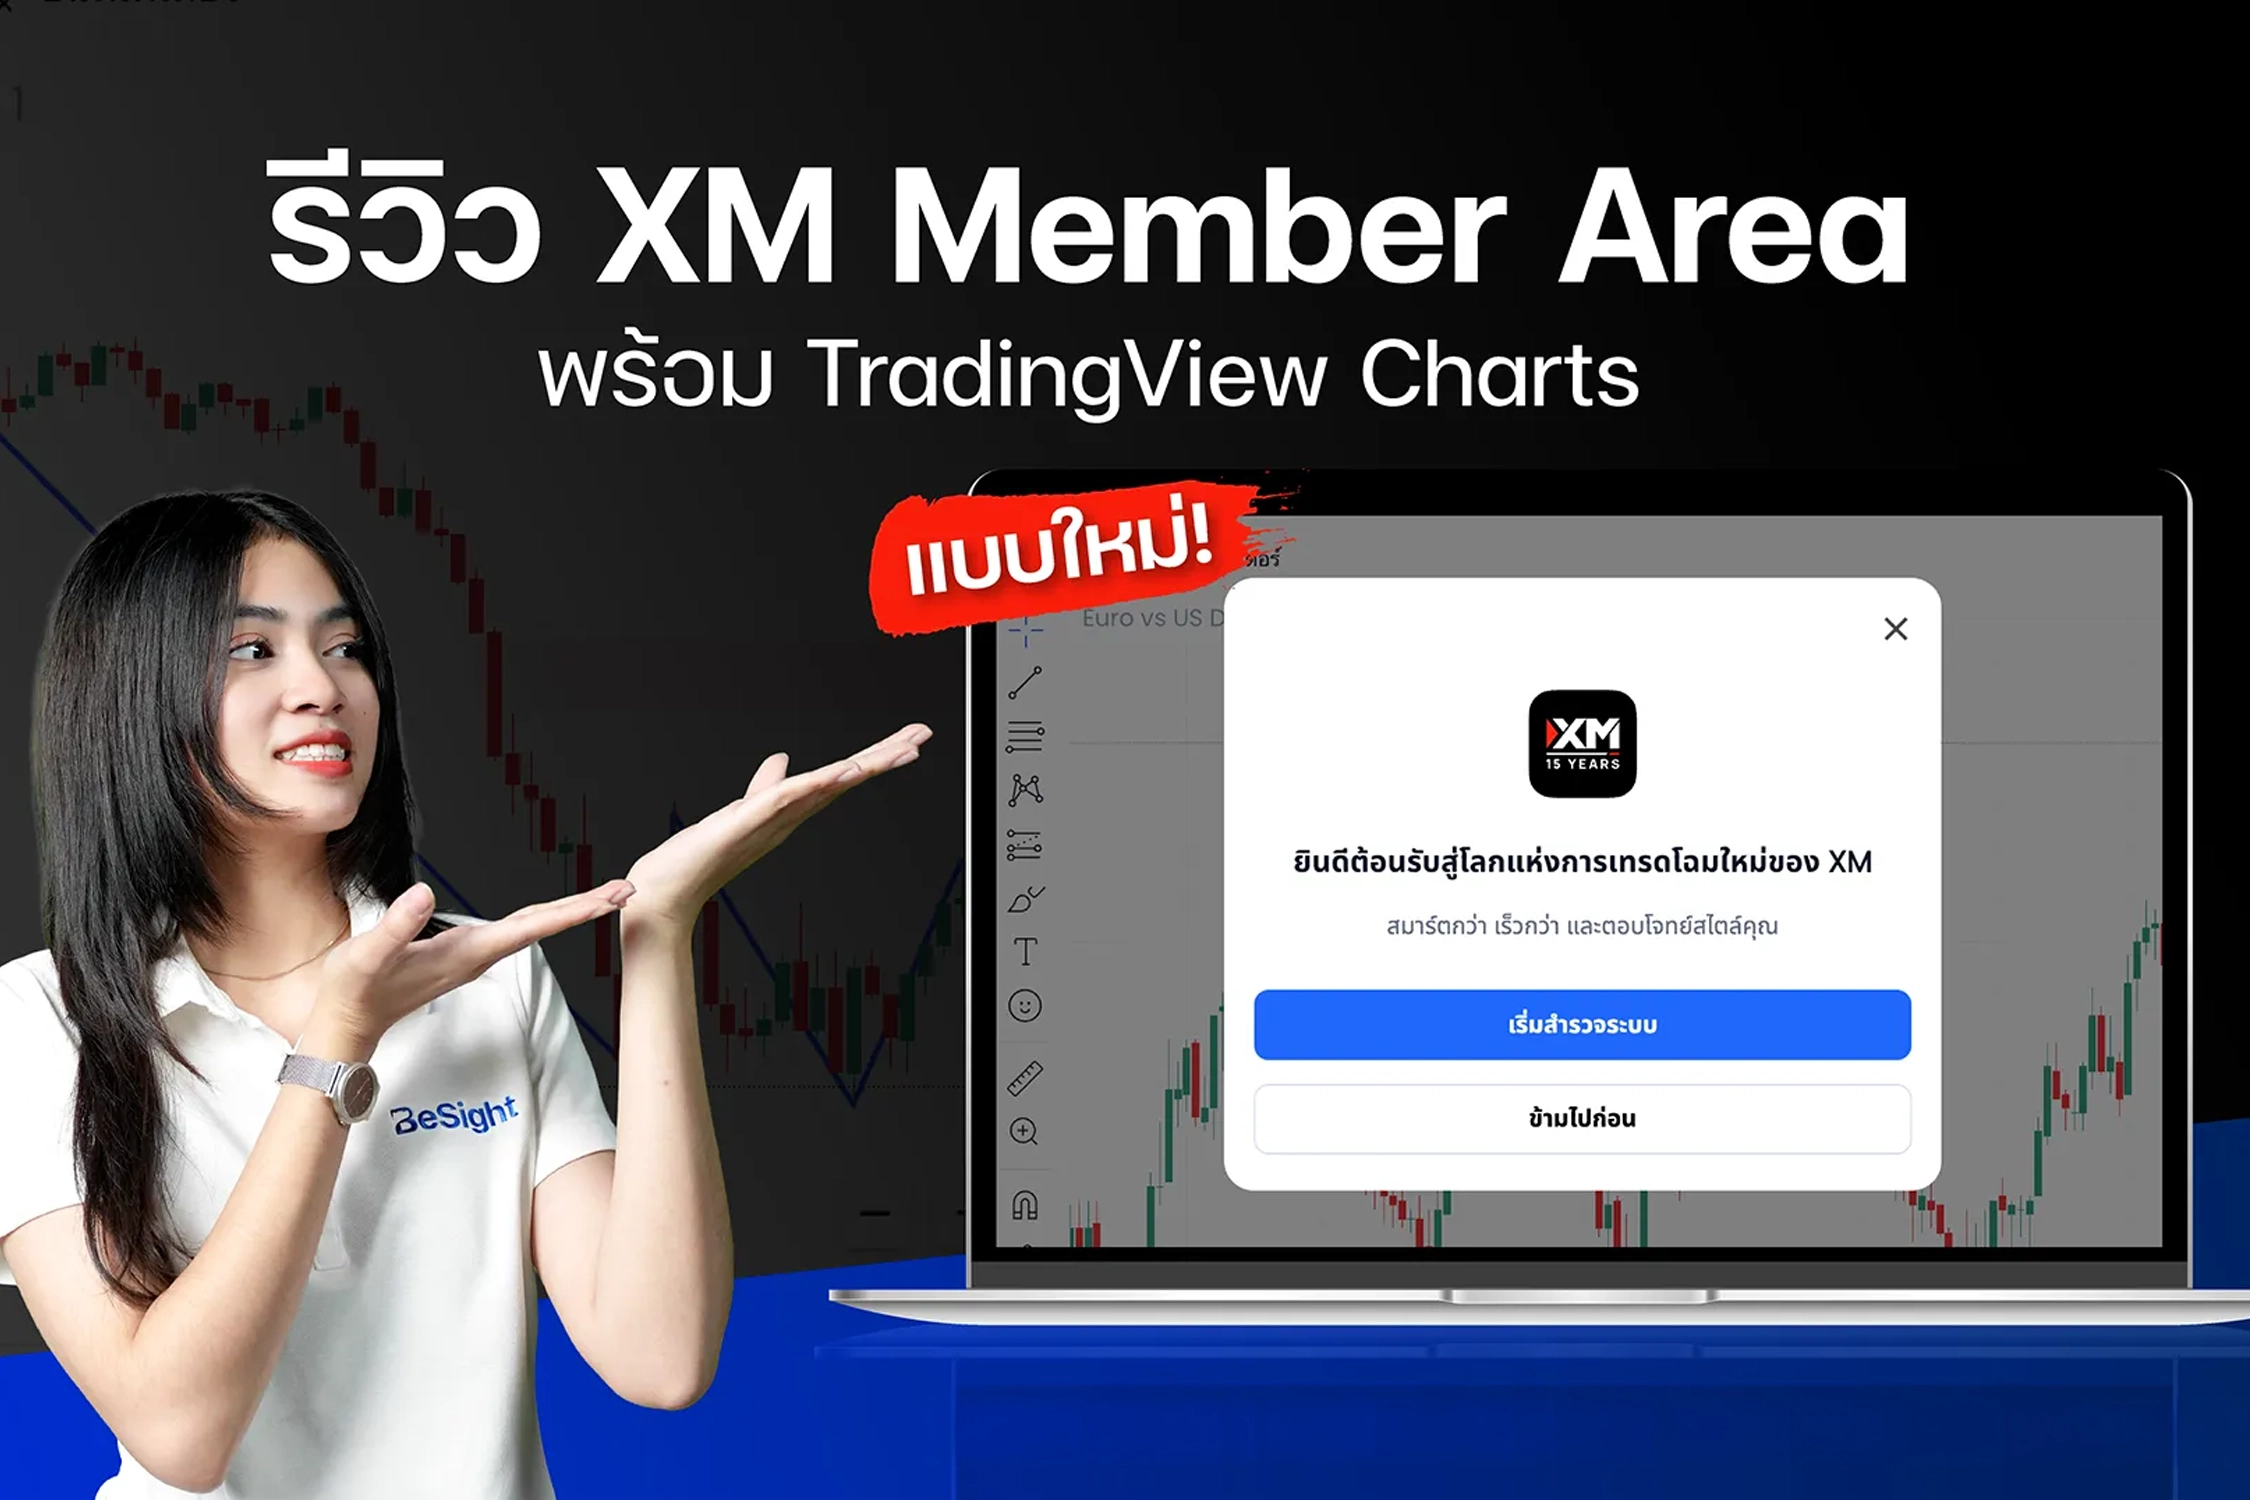
Market News
รีวิว XM Member Area แบบใหม่ | ใช้ง่ายขึ้น พร้อม TradingView Charts
XM อัปเดตพื้นที่สมาชิกโฉมใหม่ รวมกราฟ TradingView, การจัดการบัญชี, Copy Trading และการแข่งขันไว้ในที่เดียว ใช้งานได้ทั้งคอมพิวเตอร์ มือถือ และแท็บเล็ต
Market News
BeSight Update
วิธีใช้ Indicator BeSight ONE ที่บอกจุดเข้า–ออก บน TradingView
BeSight ONE คือ Indicator ที่ช่วยแสดงโซนสำคัญของตลาดทองคำ และระบุจุดเข้าเทรดที่แม่นยำ พร้อม Kill Zone, AI Zone และระบบ TP/SL อัตโนมัติ
BeSight Update
BeSight Update
BeSight แข่งเทรด MID YEAR 2025
การแข่งขันเทรดกลางปีสำหรับลูกค้า XM ที่เปิดบัญชีผ่าน BeSight ชิงเงินรางวัลรวมกว่า 20,000 บาท พร้อมเสื้อ Oversized Limited Edition สุดพิเศษ
BeSight Update